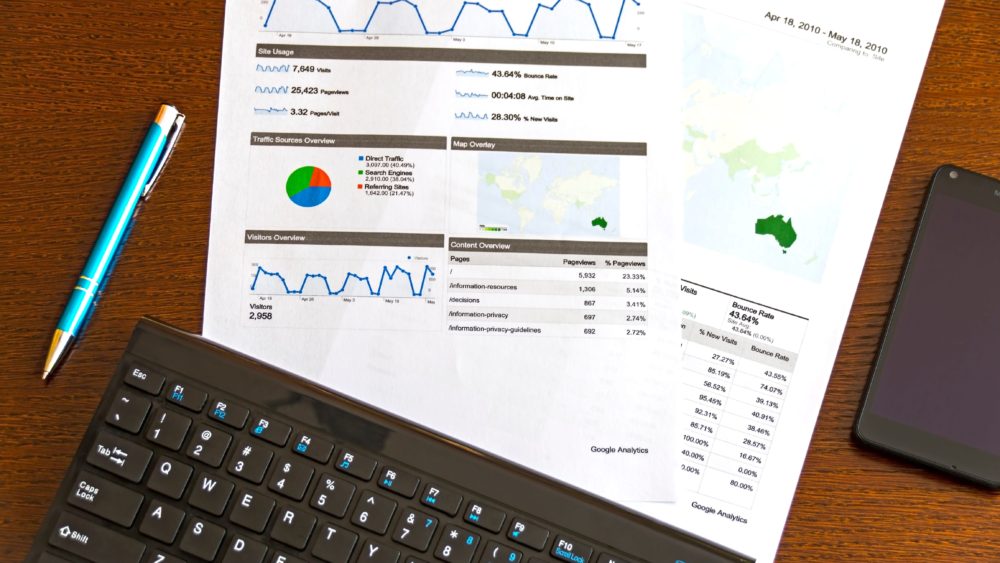
Google Analytics is kind of like having superpowers. With great power comes great responsibility.
Just kidding, but these reports do give you great power, and will enlighten you about a great many things. But they can seem a little confusing to get your head around when you are first starting out.
I have summarised for you some of the best Google Analytic reports for small business owners, and what you should be using them for.
Google analytics: what are they good for?
These services are for analysing how well your website works at getting you customers. You can use it to find out how many people come to your website, where they come from, how long they stay, and where they get up to when they leave.
You can also analyse what sort of words and phrases internet users put into search engines when they are looking for a business like yours. Embracing these services and harnessing their power means that you can increase the numbers of visitors coming to your website, and subsequently increase your business.
That all sounds like a good idea, but does it still sound a bit confusing? Here are the basics of the best five reports you should be using from Google:
Mobile performance report
As I’ve mentioned before, the majority of users will see your website on their mobile devices, especially if they are responding to a social media campaign. You cannot afford to ignore this fact, and should be ensuring that your website loads quickly and looks fantastic on mobile devices.
This report helps you with that; giving you information about what devices your customers are using to view your website, and assessing how well your site performs on the various devices.
Traffic acquisition report
This is the report you probably heard the most about and are most interested in. This one tells you how many visitors you have, and where they are coming from.
You can tell if people come through search engines, from social media, from referrals or if they are typing your address directly into the search bar.
This one will give you insight into where you should be directing your marketing campaign and budget. You can make decisions about where to focus your efforts such as guest blogs, boosted social media posts etc.
Content efficiency report
This report assesses the different pages of your website and tells you how your content is performing. You can assess which of your pages are attracting and holding people’s attention, as well as what types of content people like, such as images, videos etc. You can also tell which content prompts people to action, such as signing up or making purchases, and which content is most often shared.
Keyword analysis report
You’ve probably heard about this one too. Using this report, you can work out what keywords people search for, and which ones bring visitors to you. You can assess what keywords your competitors are using to get their customers. You can set goals, like number of people to bring to your site, or specific actions you want them to take, and see how you are going at meeting these.
You can use this report to work out which current keywords are working hard for you, and which ones you should be targeting.
New vs returning visitors
As I’ve mentioned before, new visitors are awesome, but returning visitors are customers. It is far easier to get regulars to buy from you again than it is to attract a new person to your page. Returning visitors spend more time and will look at more pages on your website.
You may be getting a lot of new visitors, but few returning ones. This would indicate that your keywords, ad campaigns or external referral sources are working well, but something on your website is not holding people.
I found it very hard to stop at just five reports, so here is an extra one you should consider using as well:
Bounce rate vs exit rate report
This report assesses if visitors to your site leave again without taking any action, and if they check out other pages on your website. You can assess at what point people are leaving and then give yourself a bit of an audit as to why. This again tests how well your content is doing, what is working and what is just taking up dead space.
Don’t get too confused
When you read it all in one go like this, the idea of so much analysis can be a little overwhelming, but don’t let that put you off. Once you start playing around with Google Analytics, like any new language, it does start to suddenly make sense. Digital marketers can help you get the bottom of the confusion if you need further help, but definitely don’t let confusion scare you away.
The ability to assess your marketing campaigns in real time, and so easily make changes that create real impact is an incredible power to have. Grab it with both hands and don’t let go.


